Eye on electricity
January prices were high due to high demand and constrained generation
- Generation
- Prices
The industry has seen elevated/high prices in January 2022. The Authority signalled this publicly on 13 January and started to dig deeper into why we are seeing unusually high prices for this time of year. Overall, we found that demand was high and supply down compared to previous Januarys.
January prices this year higher than average
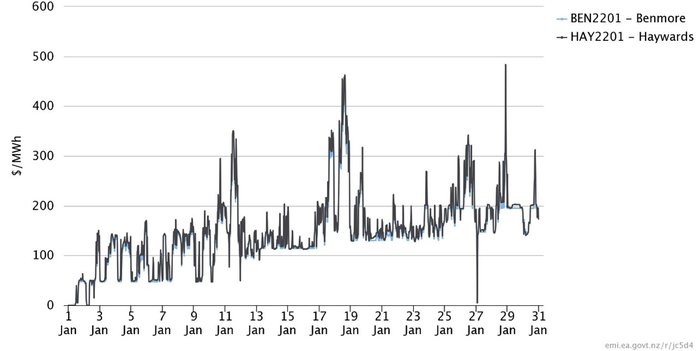
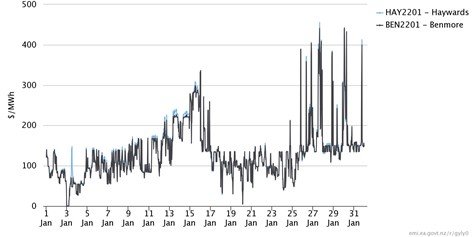
Historically, average prices for the month of January have been under $100/MWh1. However, the average price for January 2022 across all nodes was $155.52/MWh. The average price in 2021 for the same period was $134.98/MWh, which was also high. Prices this year have also been more variable, with 95% of prices falling between $5.23/MWh and $348.46/MWh (Figure 1), compared to between $43.01/MWh and $313.92/MWh last year (Figure 2). This is despite overall hydro storage being higher this year than the same time last year – so why are prices higher this year?
The increase in average price in 2022 has come from a combination of factors including above average demand, low wind generation, generation and transmission outages, low hydro inflows and decreasing hydro storage, dry year risk from strengthened La Niña conditions, and tight gas supply which is expected to increase costs of thermal fuels leading up to winter.
Prices were particularly high on 11, 17 and 18 January, spiking to above $300/MWh (Figure 1). This was primarily due to above average thermal peaker generation caused by above average demand and low renewable generation.
Demand was high due to hot and dry weather conditions
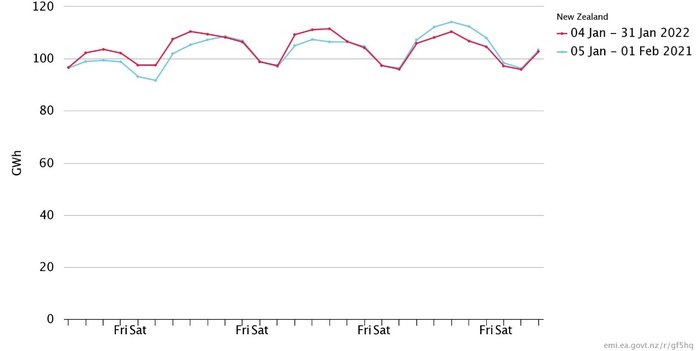
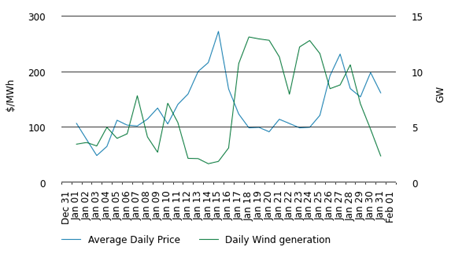
Demand this January has been higher than average due to high amounts of irrigation in the south (100-350 MW extra demand in Canterbury/North Otago) and high usage of air conditioning in the north (~200 MW) from hot and dry weather conditions. Compared to the same period in 2021, daily demand on the 11, 17 and 18 January was ~5-8 GWh higher in 2022 (Figure 3). However, in the last week of January demand was higher in 2021, with prices reaching above $400/MWh (Figure 2). Demand was lower from 24 January 2022 and may have been due to the country shifting to red under the Covid-19 Protection Framework.
High prices occur when wind generation is low
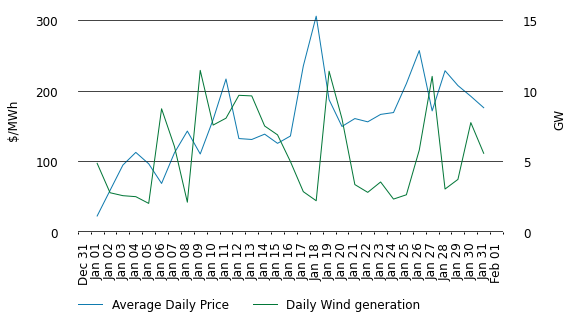
Wind generation is negatively correlated with prices. In both 2021 and 2022, high prices in January occurred on days when wind generation was low or falling (Figure 4 and 5).
Hydro storage is falling due to low inflows
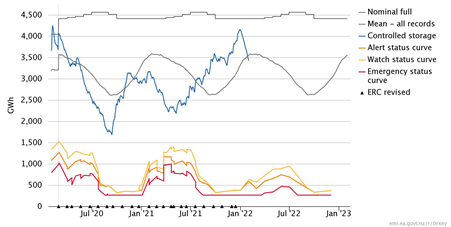
Hydro storage levels have also been falling due to low hydro inflows (Figure 6). Over January 2022 inflows totalled 1,337.1 GWh, almost half of the historical average of 2,564 GWh. In comparison, inflows for January 2021 totalled 2,127.9 GWh.
Total national controlled hydro storage has declined by over 700 GWh from the beginning of January 2022, falling to 100 GWh below average historical levels. In comparison, hydro storage in January 2021 was between 380 and 550 GWh below average historical levels the entire month (Figure 6).
The below average inflows are likely a result of strengthened La Niña conditions over December as reported by NIWA in their seasonal climate outlook for January 2022 - March 20222. During La Niña rainfall in the lower and western South Island is reduced which usually results in below average inflows and storage levels in South Island catchments. In December NIWA said that the likelihood of normal to below average rainfall over major hydro catchment areas over summer increased, with La Niña conditions having an 80 per cent chance of persisting over the first three months, raising the flag for dry year risk. As the effects of climate change become more apparent, with 2021 reportedly the hottest year on record, 2022 and ensuing years are more likely to follow the trend of more extreme weather events increasing the severity of dry years.
Data from Meridian shows snow storage in its Waitaki catchment was at 358 GWh or 80 per cent of historical average on 22 January 2022. However, the majority of inflows from snow melt usually occur in spring, which was when we had significant inflows.
Despite the drop, current total hydro storage is close to average for this time of year. Prior to the recent decrease, high inflows had built up lakes to above or near their 90th percentiles. Examining the storage levels of major lakes against their 10th to 90th percentiles over 2021 to 31 January 2022 in Figure 7 shows the major lakes of Tekapo, Pukaki and Taupo are still at healthy levels.
Lake Taupo storage is high but declining at a similar trajectory as last summer. Inflows during January averaged to 3.4 GWh/day, compared to 6 GWh/day during January last year.
Lakes Wanaka and Wakatipu (which provide about 85% of inflows at Clyde and Roxburgh) are low, below their 10th percentile. While these lakes are uncontrolled storage, outflows at Clyde and Roxburgh must match inflows from these lakes, and inflows are low when lake levels are low.
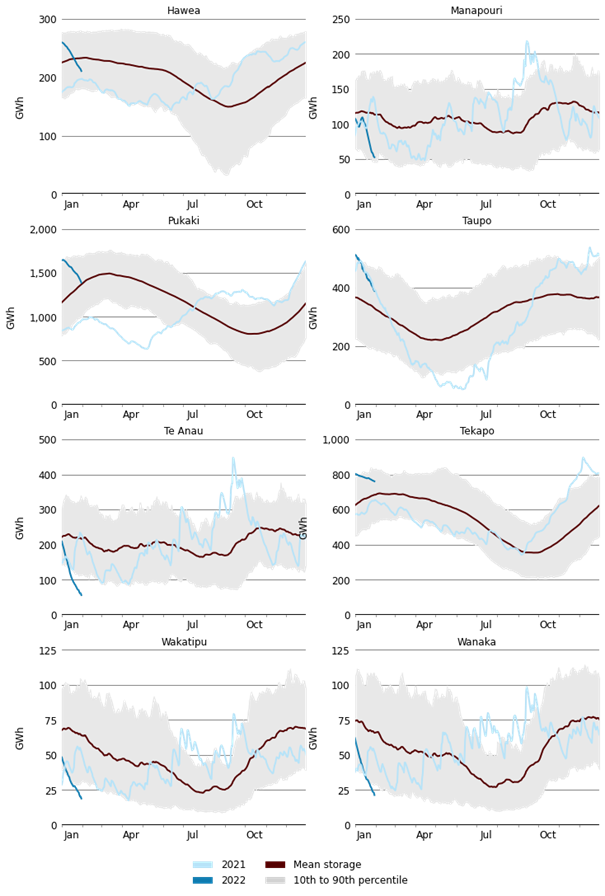
Since late last year Lake Tekapo has been forced to spill water to avoid going over its maximum operating range of 710.9 metres above sea level. The build-up of water is a result of Genesis upgrading its Tekapo B station from early October 2021 which has reduced its generation capacity to 80 MW, effectively halving its ability to take water. Currently the outage is scheduled to last until 7 Feb 2022. Only in the last couple of weeks has the lake stopped spilling.
Lake Te Anau is facing the opposite situation having hit its minimum operating range of 201.5 metres above sea level due to low inflows. This has reduced inflows into Manapouri, which resulted in lake levels dropping from just below average lake levels to their lowest 10th percentile.
Meridian had to provide flushing flow at Manapouri
Meridian notified the Authority monitoring team on 26 January 2022 that they expected to hit Manapouri’s low operating range by the end of the week beginning 24 January 2022. When that happens operating guidelines apply that (amongst other things) require Meridian to use its best endeavours to ensure lake drawdown does not exceed the natural rate of drawdown averaged over four days, being 0.05m per day for Lake Manapouri. In this case, with low forecast inflows into Lake Manapouri, this constrains generation from Manapouri to an estimated ~6-6.5 GWh per day (a third of Manapouri’s total capacity). Usually to manage the situation Meridian would only shift offered generation into higher priced offer tranches. However due to current market conditions where there are already a high amount of high priced offers being dispatched Meridian intended to also withdraw capacity from the market over the weekend and possibly Monday to maintain full control over drawdown of the lake.
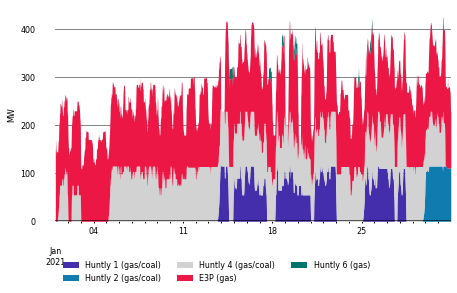
Huntly’s output constrained by river temperatures and gas outage
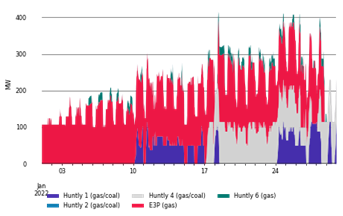
Increased Waikato River temperatures have restricted Huntly’s ability to run. Huntly Power Station Resource Consent states the maximum temperature of the river 1 km upstream of the Huntly Power Station cooling water outlet is to be 25 degrees Celsius (generally). Genesis informed the Authority that the Waikato river is at record high temperatures (tracking over a degree higher than previous highs at times) and Rankine volume is likely to be curtailed daily throughout January with ongoing issues until March unless there is a change in weather patterns.
As a result Genesis has usually only been running one Rankine unit, especially prior to 24 January (Figure 8). In comparison, in January 2021 two Rankine units were frequently running from about 13 January, with only a few days where they had to reduce the output to one unit due to Waikato river temperatures (Figure 9).
There was also an outage of the Maui Pipeline for repairs which started on the evening of 28 January. Genesis scheduled an outage of the E3P to as there was insufficient gas supply to keep the E3P unit running during the outage. Higher cost generation, mostly North Island hydro, was dispatched to make up the shortfall causing prices to briefly spike above $500/MWh.
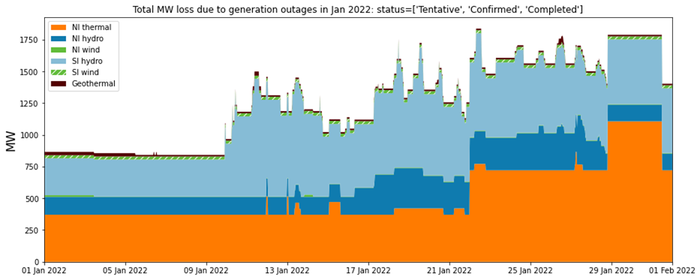
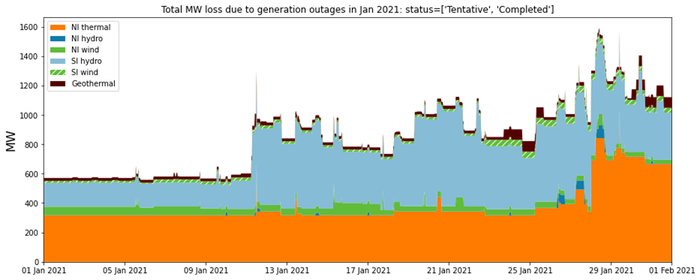
High amounts of generation were on outage
There is also a high amount of generation on outage for maintenance. Generation outages are usually scheduled for the summer months when demand is low and less capacity is needed. However, there is a higher amount on outage this January - frequently over 1250 MW (Figure 10) - while last January outages were rarely above 1250 MW (Figure 11) except towards the end of the month (when high prices occurred). Some of these outages were likely scheduled to coordinate with transmission outages, such as the Clutha Upper Waitaki Lines project in the lower South Island which began in 2020.
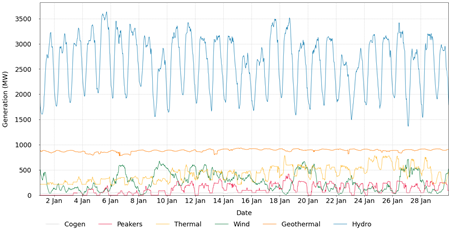
Thermal generation was dispatched to meet demand
When coinciding with periods of low wind generation the restricted hydro and Huntly generation has caused peaker generation to increase. Hydro generation in 2022 (Figure 12) was higher than in 2021 (Figure 13 ) (lake levels were lower in 2021). In turn thermal generation in 2021, particularly from Huntly, was higher. This year output from Huntly has been restricted so generation from Junction Road and Stratford Peaker power plants have increased significantly in 2022.

The cost of thermal fuels has increased
High gas prices from restricted local gas production and high coal prices from international coal shortages have increased the SRMC of thermal plants as well as increased the opportunity cost of running thermal generation. With generators wanting to conserve fuel, thermal generation has thus set the marginal premium, explaining the higher average prices seen in 2022.
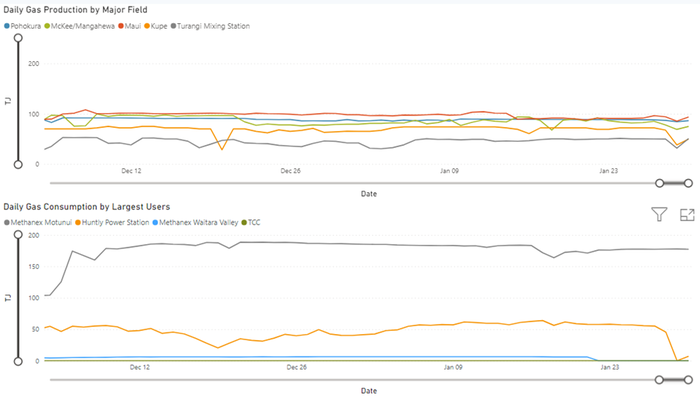
Total production from major gas fields over January has averaged around ~380 TJ/day (Figure 14). Average January gas production from 2019 to 2021 was 402.6 TJ/day for comparison. An unplanned outage on 18 January 2021 dropped production at McKee/Mangahewa by 20 TJ/day.
As gas production levels are unlikely to increase significantly in the next six months should hydro inflows continue as they are currently there is a high possibility we will see a repeat of last year with Genesis invoking its swaption with Methanex as the industry leaned heavily on thermal generation in order to support baseload demand.
Carbon unit prices on the secondary market are currently greater than $70/tonne. As approximately ~40 per cent of the price of carbon is added to the final cost of generation for a CCGT and ~50-60 per cent for OCGTs we can expect an additional ~$28/MWh to be added to thermal generation and ~$35/MWh to be added to thermal peaker generation. Added onto the cost of gas we should expect the cost of thermal generation per MWh to at minimum be in the high one hundreds this winter.
Coal and diesel prices have substantially increased over the last year, due to global supply and demand issues, though Genesis buys coal under contract prices. The 2021 closing balance of Genesis’s coal stockpile totalled 835,000 tonnes or 18 PJ which is approximately 5,100 GW, enough for the Rankines to run for a sustained period over winter. This is the highest level of coal stockpiled since December 2014.
Whirinaki is a high cost diesel generator which is intended as a last resort generator to meet peak winter demand. In January 2022 Whirinaki generated 814 MWh, predominantly on 18 January. This is three times higher than Whirinaki has generated in any January since 2010, and Whirinaki was not dispatched at all in January 2021.
Why did prices spike so high on 11, 17, 18, 26 and 28 January?
The first price spike seen in January was on 11 January, when prices increased from around $100/MWh to over $300/MWh during the day. The following factors discussed above were also contributing factors on this day - demand was high for January, wind generation dropped significantly during the day, there were several large units on outage at Ohau, Clyde, Roxburgh and Manapouri and only one Rankine unit was able to run due to high river temperatures.
In addition to these factors Manapouri’s generation was much lower than the previous week, even taking into account the outages of two units at Manapouri. This was due to Manapouri needing to provide a flushing flow down the Lower Waiau River for 24 hours on 12 January to assist in managing periphyton biomass (didymo)3.
On 10 January environmental indice4 indicated a flushing flow was required on the Lower Waiau River. Execution of a sufficiently large flushing flow5 requires a high Lake Manapouri level. The lake level was not sufficiently high to achieve this flow at the time and therefore in anticipation of possibly providing such a flow, steps were taken to conserve storage to enable the flushing flow to occur by reducing low-priced offers at Manapouri from 8 to 11 January 2022. This was particularly noticeable on 11 January when only 220 to 328 MW was offered in low tranche compared to 550 to 660 MW on 6 January. During this time, Meridian took steps to balance their generation by increasing generation volumes offered at low prices from the Waitaki scheme to offset the reduction in low priced generation volumes offered at Manapouri.
Due to the lower generation at Manapouri as well as outages at Clyde and Roxburgh, the transmission lines Clyde-Roxburgh 2 and Livingstone-Naseby were flowing south. At the same time there was a transmission outage of Clyde-Roxburgh-1 which constrained, forcing generation from Manapouri to increase. Meridian shifted more generation into its lower priced tranches when it realised transmission outages were causing an increase in local demand but it was not enough to lower prices.
Due to the reduction in available generation in the South Island, the HVDC transfer north was low. This increased the demand for North Island generation, increasing prices in the North Island.
On 11 January Mercury offered a total of 912 MW for the majority of the day. In trading periods 20 to 22 there was reduction of total volume offered due to an outage of a Maraetai unit (36 MW) which reduced the total offered to 877 MW until trading period 23 when the offer volume returned to 912 MW. In trading periods 35 and 36 another Maraetai unit (36 MW) was returned to service which increased the total offered to 948 MW. Unfortunately, this unit was removed from Mercury’s offers in trading period 37 due to issues with the unit and the total hydro offered was reduced back to 912 MW. In trading period 40, weed issues at Whakamaru meant offers had to be reduced to 882 MWs for the remainder of the 11 Jan. The volume of 912 MW was the highest volume offered (excluding the trading periods 35 and 36 on the 11 Jan) until trading period 30 on 14 January when weed issues at Whakamaru were partially resolved increasing the total offered to 943 MW. Mercury told us that it sets its offer prices after considering the supply stack, underlying market conditions and its own net position (which in recent times has become heavily influenced by the wind generation output at the Turitea wind farm). On 11 January, these factors resulted in Mercury offering more of its hydro generation at higher prices than later in the week when a maintenance outage at the Turitea wind farm meant there was no generation contribution to the market from that windfarm.
There was an increase in generation from thermal peakers, and Whirinaki was briefly dispatched due to a drop in wind generation.
High prices occurred again on 17 and 18 January 2022 reaching over $450/MWh. On these two days demand was high for January, and wind generation dropped to between 0 and 250 MW. There were also several generation outages at Clyde, Roxburgh, Manapouri, Tekapo, Ohau and McKee. Whirinaki was dispatched both days, particularly on 18 January when it ran most of the day, despite being the highest cost thermal peaker.
E3P was not dispatched overnight on 17 and 18 January, but two Rankine units were running at a higher dispatch than E3P usually runs overnight. Huntly 6 started at 6:00am and E3P at 6:30am, which was when the price first increased above $350/MWh. From 7am to about 9:30am Huntly’s output was much higher than normal with two Rankines, E3P and Huntly 6 all running, after which one of the Rankines ramped down, likely due to high river temperatures. It was after this that prices increased above $400/MWh.
The other factor in causing high prices on 17 and 18 January was that hydro generators had increased offer prices as storage levels continue to decline. For example, Mercury increased their highest tranche from just over $400/MWh to $500/MWh on 18 January. Mercury has indicated that the quantity in their highest tranche would require inefficient operation of their units to dispatch which increases maintenance costs. Therefore, they may have increased the price of this tranche to reduce the likelihood of needing to run their plant inefficiently.
Prices on 26 January 2022 were due to above average demand and similarly as above, high-priced generation being dispatched. Falling wind and Huntly generation resulted in high priced hydro offers being dispatched. Demand was possibly higher on the day due to the recent nationwide shift to red (there has been a trend following shifts in alert levels where daily demand spikes). With business still being open but people advised to work from home we may possibly see a rise in residential consumption while commercial consumption remains the same.
The price spike on 28 January 2022 occurred between 9-9:30pm and was primarily due to expensive North Island hydro generation being dispatched following the loss of Huntly’s e3p gas powered unit. Huntly had closed its e3p unit due to scheduled repair work being carried on the Māui gas pipeline by Firstgas. As it was Auckland Anniversary weekend it was considered the best time to put the pipeline on outage. While the system adjusted to the loss North Island hydro ran particularly hard with schemes at Patea, Whakamaru and Waipapa running the hardest at maximum capacity. As hydro generation was priced highly due to declining hydro storage and generators appearing to be concerned over dry year risk this drove spot prices to above $500/MWh.
Are these prices consistent with competition?
The above analysis indicates that the recent high prices are consistent with underlying conditions and are likely to continue until there are significant hydro inflows. In terms of the price spikes signalled for further investigation in the weekly trading conduct reports (11, 17 and 18 January), we have found no evidence to suggest a referral to the compliance team of any behaviour by any generator. However, as with the competition review, there is still ambiguity in assessing whether the overall level of recent prices compared to historical levels are consistent with competitive outcomes. This is because we cannot account perfectly for gas supply uncertainty. That is, what risk premium should be added to the short run marginal cost (SRMC) of thermal generators and what impact this has on water values with thermal often being the marginal price setter for hydro generation. We will continue to monitor the situation closely. A review of price outcomes under the new trading conduct rule will be undertaken in the future once we have sufficient data to look at a longer timeframe, comparing offers and prices before and after the implementation of the new rule.
1. Based on data from 2010 to 2018
2. https://niwa.co.nz/climate/seasonal-climate-outlook/seasonal-climate-outlook-january-2022-march-2022
3. Since the arrival of didymo in the Waiau Catchment in 2004 Meridian has funded extensive monitoring of nuisance periphyton biomass in the Lower Waiau River. As part of a 2010 consenting process, a flushing flow protocol was required to be developed to manage nuisance periphyton as a condition of the consent.
4. Traffic light indices for periphyton management have been developed by NIWA specifically for the Lower Waiau River. The traffic lights are green (all is well), amber (a supplementary flow response should be considered) and red (a supplementary flow response is required).
5. flow peak of >160m3/s and mean flow of 120m3/s over 24 hours.
Related News
Marginal generators and prices in the electricity market
In the New Zealand wholesale electricity market, the price paid to dispatched generators is the nodal ‘spot price’, which is priced to reflect the ‘marginal’ g…
Energy margin data to be published monthly
The Electricity Authority Te Mana Hiko is introducing a new requirement for electricity generators to provide information.
New interactive Solar Installations Map tool
The Electricity Authority Te Mana Hiko has released an online interactive map to help people get a better view of solar power in their neighbourhoods.