Eye on electricity
Past and future spot market volatility
- Wholesale
- Prices
Half-hourly electricity spot prices reflect the underlying conditions in the electricity market. This article explains what’s behind the emerging spot market volatility, what we can expect in future, and how the Electricity Authority is supporting the industry with market changes.
What is spot price volatility?
When there is abundant wind and hydro generation, electricity spot prices are low. However, if more expensive generation is needed, prices can spike. This swing from very low to high prices is called price volatility.
As New Zealand builds more renewable intermittent electricity generation, spot price volatility will continue. Electricity buyers and sellers will need to adjust their trading to manage the risks and opportunities of price volatility in the spot market.
Spot market volatility has been on the rise since 2018
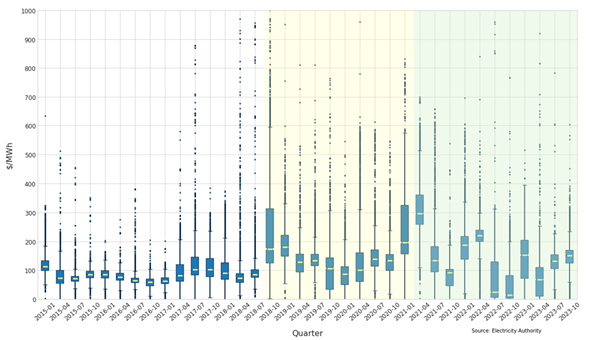
Spot price patterns have changed as the market has evolved. The quarterly distribution of nationally averaged electricity spot prices, adjusted for inflation, from 2015-23 is shown in Figure 1. The yellow lines show each quarter’s median price, while the blue boxes show the lower and upper quartiles, where 50% of prices fell. The “whiskers” extend to points that lie within 1.5 times the size of the box. Data points outside this range are displayed independently. The smaller and more compact the box and whiskers, the less volatile prices were that quarter, and vice versa. Also, when median quarterly prices were similar, prices were less volatile between quarters.
From 2018 onwards spot price volatility increased, as shown by the larger inter-quartile range and greater number of outliers (see yellow highlight in Figure 1). In 2018, New Zealand’s largest producing gas field, Pohokura, began to decline. This caused volatility as gas buyers, including those who use gas to make electricity, and gas sellers became less certain about future gas availability. Since early 2021 (see green highlight in Figure 1), spot price volatility increased even further, with a greater variation in quarterly spot prices.
High renewable generation sees very low prices
Renewable generation in New Zealand has been increasing. Between 2020-23 installed wind generation increased by 44%, from 885MW to 1,280MW. Several new, and extensions to existing, wind farms are planned to come online in the next few years. These additional wind turbines will see spot prices fall when wind generation is high. Other renewables, such as solar farms and new geothermal power stations, are also in development.
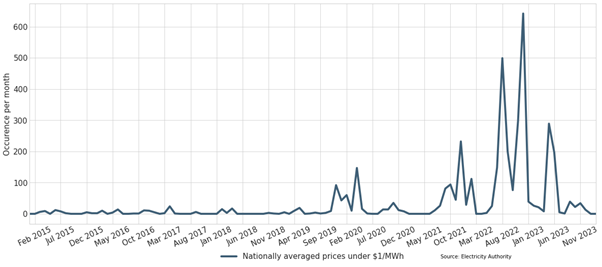
When the electricity system operates with mostly renewable generation, either very high hydro and / or wind generation, prices often fall below $1/MWh. Monthly occurrences of nationally averaged spot prices under $1/MWh between 2015-23 are shown in Figure 2. In December 2019, extreme South Island rainfall brought very low prices. Again in 2022, record rainfall also caused low prices. Since 2020 the occurrence of prices under $1/MWh has increased when compared to 2015-19.
Volatility can also be seen in forecast prices
Not only is there volatility in finalised spot prices, but there is also volatility between final and forecast prices. Price forecasts are produced by the system operator leading up to each half-hourly trading period. These forecasts signal to generators whether their units are required to meet expected demand - and the likely spot price they will receive if they do run. However, we are observing an increase in cases where final prices are higher than forecast prices.
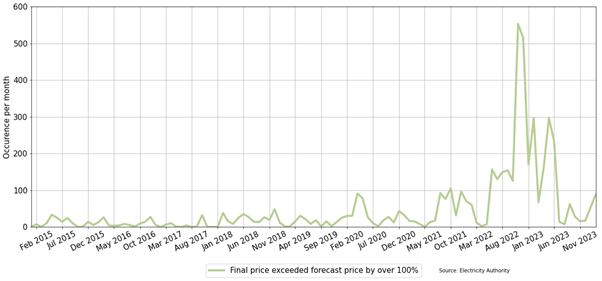
Figure 3 shows occurrences per month from 2015-23 when the final price was over 100% higher than the forecast price1. Starting in 2022 there were several months where final prices exceeded forecast prices by over 100%. This often occurred when either wind or demand was forecast inaccurately. As New Zealand builds more wind and solar farms, the proportion of electricity generation which is intermittent will increase. This may cause further volatility between final and pre-dispatch prices.
Helping the industry adjust
The Electricity Authority wants to help the electricity industry adjust to spot market changes as New Zealand builds more renewable intermittent generation. As part of our winter 2023 work, we instructed Transpower to show spot price sensitives in forecast prices. This gives industry participants a better view of the likely range of spot prices in a trading period to inform their trading decisions.
The Authority is also working to improve the forecasting of intermittent generation. We are currently considering feedback on proposed solutions to improve the accuracy and frequency of intermittent generation forecasts to decide which option to progress for winter 2024.
1. PRSS price at gate closure
Related News
New quarterly over-the-counter market bids and offers summaries
The Electricity Authority Te Mana Hiko gathers information to gain deeper insights into the electricity markets to help ensure current market rules are working…
Voluntary super-peak trading sessions for new OTC trading platform
Two voluntary trading sessions for standardised super-peak hedge contracts will take place in July on the new over-the-counter trading platform.
Energy margin data to be published monthly
The Electricity Authority Te Mana Hiko is introducing a new requirement for electricity generators to provide information.