Eye on electricity
Accuracy of the forward price curve
The ASX forward price curve provides a view of future wholesale spot prices. How accurate has the market’s view been?
- Distribution
- Wholesale
- Prices
Recent analysis by the Authority shows that the forward price curve provides an unbiased indication of future spot prices under expected market conditions. This allows participants to confidently manage the risk of spot prices differing from expected market conditions, and to make efficient decisions.
The analysis also shows the benefit that hedging ahead of time has provided in the past few years to large consumers and independent retailers. As expected prices for the past few years were on average significantly lower than the final wholesale price, those who hedged their demand far in advance received a significant cost saving on the wholesale price.
Four of the largest generator-retailers (Genesis, Mercury, Meridian and Contact) are ‘market makers’ obliged to buy and sell electricity futures contracts on the ASX trading platform. This enables other industry participants – notably retailers and large commercial consumers – to ‘hedge’ their future cost of electricity.
This provides a mechanism for market participants to manage their exposure to fluctuations of electricity prices in the spot market. The trading of electricity futures provides a ‘forward price curve’. This curve represents the futures market’s aggregate view of the wholesale price of electricity at given periods of time in the future.
The final value of a futures contracts settles against the average wholesale spot price in a certain location to which they are indexed, currently either at Benmore or Otahuhu, over a certain period of time. Before these contracts expire, and the final settlement price is known, the value of these contracts reflects the current market perception of the expected future wholesale electricity price.
The Authority monitors the forward price curve based on data supplied by ASX. The data allows the accuracy of the forward price curve as a predictor of future electricity spot prices to be measured.
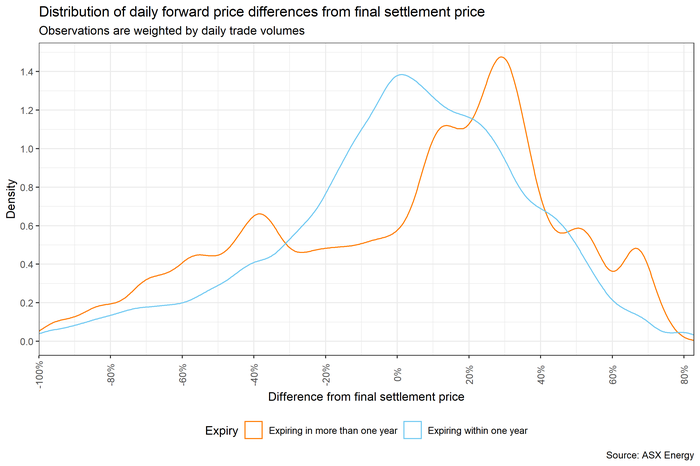
Differences between the daily settlement prices and the final price weighted by daily trade volumes are distributed roughly around 0, however, there have been some persistent differences in recent years for contracts expiring more than one year in the future.
Based on ASX data we can calculate the difference at any point in time between a contract’s settlement price on a given day and its final settlement price.
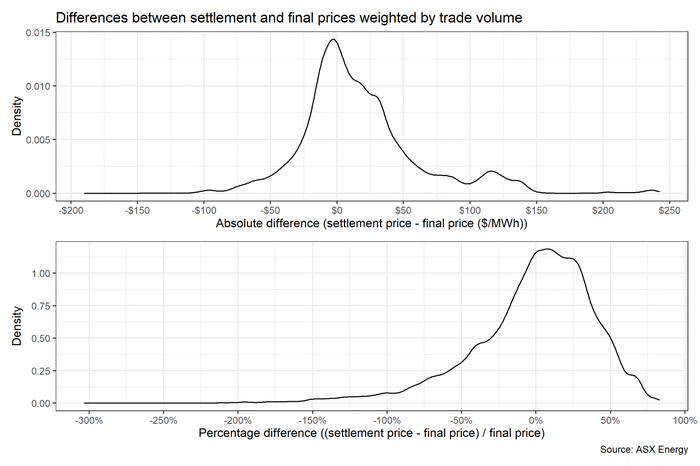
As shown in the graph above, settlement prices are approximately normally distributed around $0. The high volatility of the spot market represents itself through the large spread of the distribution, with a significant volume of contracts trading at a $50/MWh difference or more from the final settlement price.
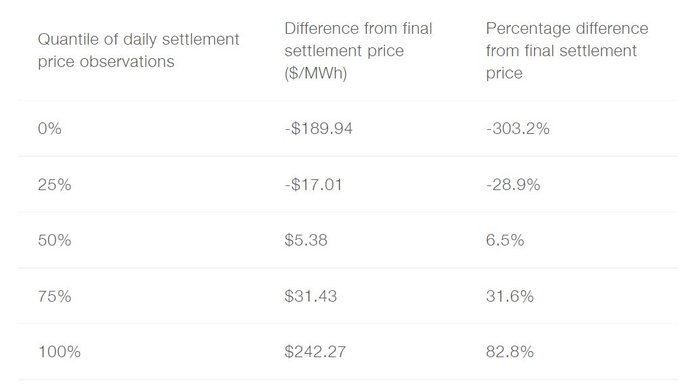
These differences have a slight positive skew. The final price of a market-made contract tends to be about 6.5 percent higher than the median observation of its settlement price throughout its lifetime.
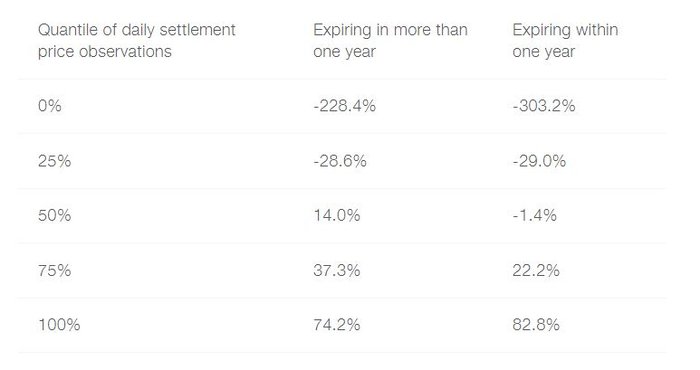
This increases for contracts further out from expiry, as in Figure 2 below. The front end of the forward curve, for contracts expiring within a year, is distributed around 0 percent. However, there is a persistent bias further out, where the forward price is lower than the final settlement price.
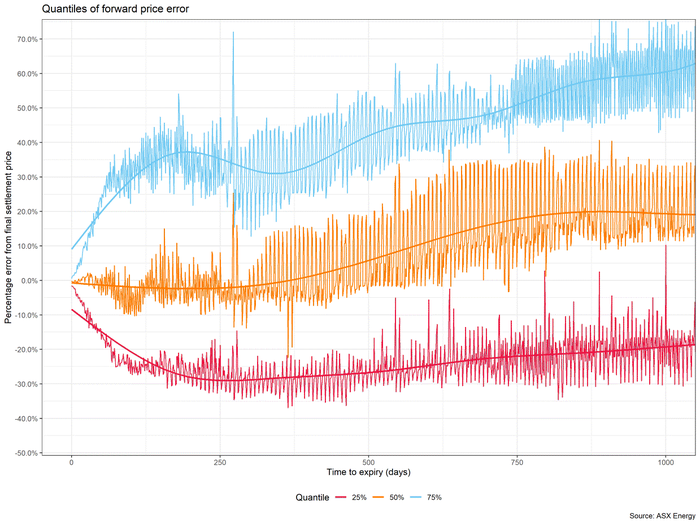
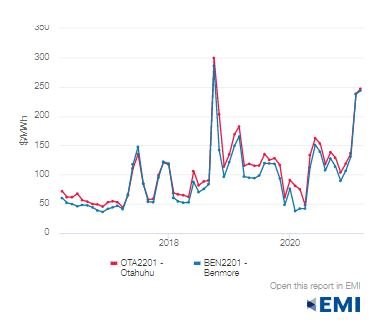
Further, the difference for long term expiries has been more significant within the last few years. Particularly, in late 2018 when there was an increase in wholesale prices linked to an unexpected outage of the Pohokura gas field, futures prices before the Pohokura outage underestimated the final settlement price.
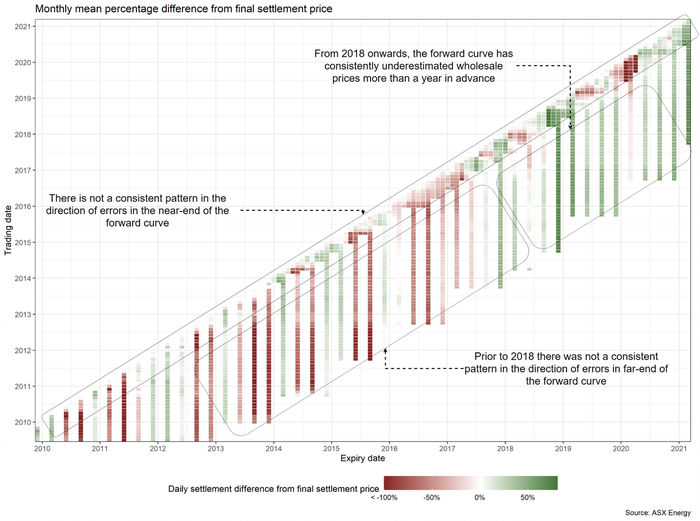
This indicates that the futures market persistently underestimated the forward wholesale price for periods more than a year in the future over the last few years of trading. The new information about the Pohokura situation created an unforeseen change in price levels, which explains the difference in prices.
This correlates with the increase in wholesale prices in this period as shown in the graph below.
Again, this is located in the far-end of the curve, where the median difference is 14 percent. Compared to the near end where the median difference is -1.4 percent.
Given the level of volatility, risk and uncertainty involved in these futures contracts, it does not appear that this persistent difference in the far-end of the forward curve over the past few years has been sufficient to incentivise ASX participants to buy against the long-dated forward curve. Through the de-anonymised trading data provided to the Authority by ASX, we are aware of speculative activity occurring in New Zealand electricity futures. If there was a large and persistent difference between futures and spot prices that could be predicted in advance and safely arbitraged, one would expect to see increased speculative behaviour, which would in time reduce or remove the bias.
In the near term, the forward curve is an unbiased (though highly volatile) estimator of the final spot/settlement price for the period. In the longer term, we have observed a persistent bias in the past few years. This is attributable to higher wholesale prices over this period linked to issues such as gas availability. As the settlement price at any point in time reflects the expected value of the final price for a future period, this indicates that the high wholesale prices observed in recent years were not expected events, and hence forward prices were significantly lower in advance of these high price events. This shows the utility the forward curve provides for risk management.
Related News
Energy margin data to be published monthly
The Electricity Authority Te Mana Hiko is introducing a new requirement for electricity generators to provide information.
Roadmap for distribution system operation published
The Electricity Authority Te Mana Hiko has published a roadmap for distribution system operation in New Zealand.
Consultation opens on proposals to refine the TPM
Today, the Electricity Authority Te Mana Hiko opened consultation on proposed amendments to the Transmission Pricing Methodology to improve its efficiency and …