Eye on electricity
Electricity market performance from January to June
- Generation
- Strategy
During the first half of 2025, the electricity market responded to changing levels of hydro, thermal and wind generation. Hydro inflows were unusually low until March. Wind generation was also low during this time and additional thermal generation came online. Hydro storage then improved from May, alongside a gas deal made by Methanex, causing wholesale prices to fall. This article summarises key findings from our two quarterly market performance reviews published this year so far.
Between January and March this year, inflows of water into hydro storage lakes were particularly low. As shown in Figure 1, hydro inflows for this period (the red dash line) were the lowest on record, by about 850 gigawatt hours (GWh), with records dating back to 1926. This decline in inflows meant that hydro storage dropped sharply.
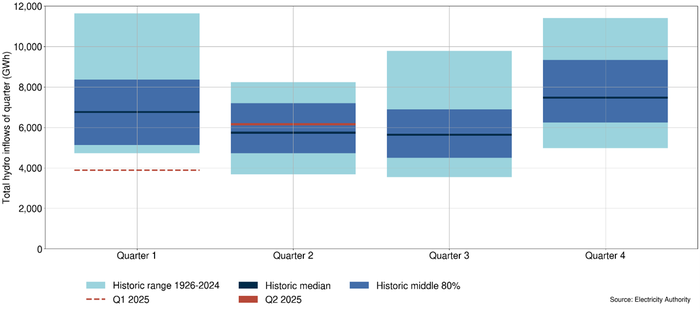
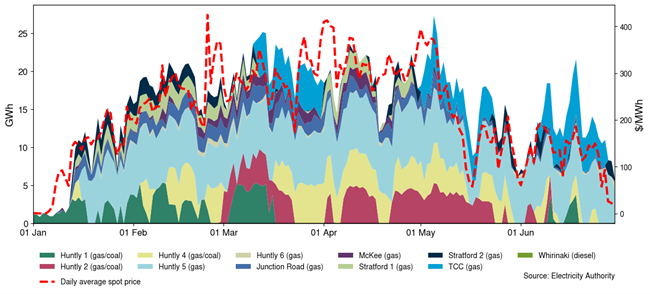
As hydro storage declined, hydro generators increased prices for their generation. This reflected the need by hydro generators to conserve water, especially heading into winter. Consequently, more thermal generation came online this year than is typical for January to April and prices steadily increased above the historic average from February as a result, as can be seen in Figure 2.
Problem compounded by low wind generation
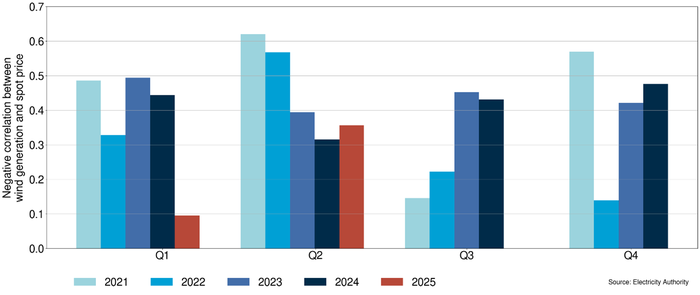
Higher wholesale prices resulting from declining hydro storage were compounded by periods of low wind generation. Generally, wind has an inverse relationship with average wholesale price, ie when wind generation is high, spot prices are low, and vice versa. This is because wind generation has low operating costs associated with it, so when the wind is blowing, generators will offer all their generation into the market. This means wind generators can offer a lot of generation at low prices, reducing the need for more expensive generation like thermal.
From January to March this year, however, due to low wind generation, wind did not have its usual impact on pricing. Figure 3 shows that the correlation between wind generation and spot prices during these months (the red bar) was the lowest it has been for this period in recent years. Prices were instead driven by the declining trend in hydro storage and the increased trend in thermal generation. This correlation improved in Q2.
Price drops after gas deal and hydro inflows
After this period of higher spot prices, prices fell during May and remained low into June. This decrease in prices coincided with a deal struck between Methanex, Genesis Energy and Contact (see Figure 4). This deal meant that Methanex reduced production and made gas available to these generators.
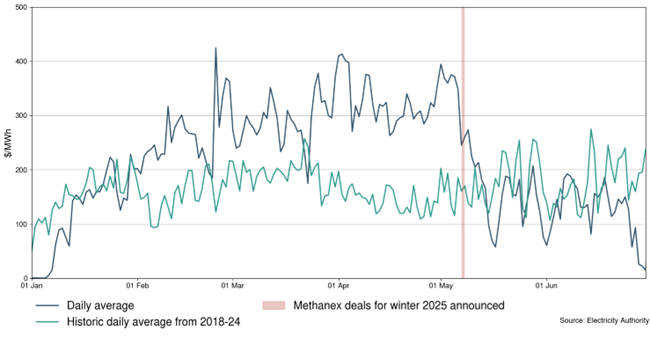
Increasing hydro inflows through May also contributed to decreased wholesale prices, as hydro generation increased and less thermal generation was required. While hydro inflows improved overall, hydro storage in some lakes was still low. Aside from Manapōuri and Te Anau, all other South Island catchment lakes remained below their average levels into June.
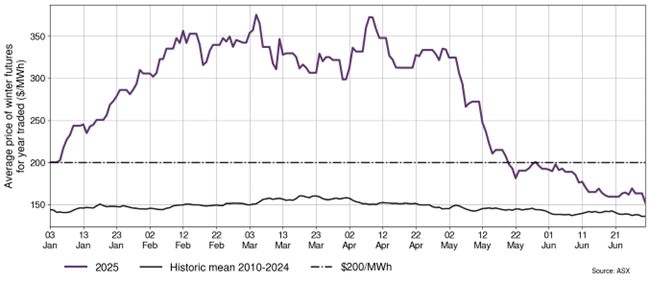
Changing hydro inflows through the first half of the year influenced the forward electricity market as well as wholesale prices. By the end of March, winter 2025 forward prices increased sharply as hydro storage declined, reflecting uncertainty about hydro storage levels going into winter. By June, however, winter forward prices had dropped as hydro inflows improved in May. The gas deals with Methanex also helped lower winter forward prices, as certainty about the gas supply for winter improved, as shown in Figure 5.
Demand below historic average
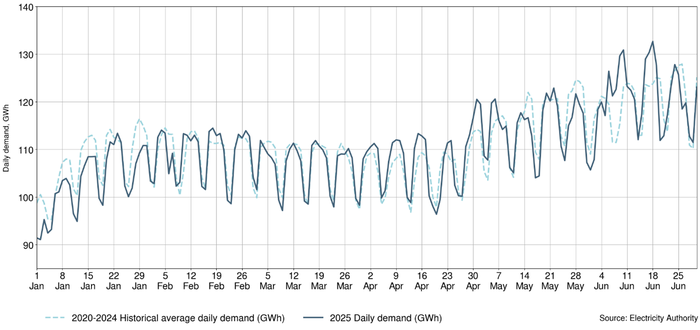
Daily demand, shown in Figure 6, has been similar overall to previous years, aside from in January and June. In January, demand was consistently below the historic average. A combination of factors led to this, as industrial consumption and irrigation load were lower than average for January. Temperatures were also lower than usual, leading to less cooling demand than previous years. June also saw colder conditions than usual, however, during winter, these drive demand up as more heating is used.
Increases in lines charges led to rise in retail prices
Retail prices increased significantly from April to June, mainly due to increases in lines charges. Using inflation adjusted terms, this increase is around $290 per year for an average household using 8000kWh/year compared to one year ago. Note there are large regional differences in tariff rises, and these are visualised in the regional power prices dashboard.
The Electricity Authority Te Mana Hiko monitors the energy market to ensure wholesale prices are reflective of underlying energy supply and demand conditions and also analyses changes in the retail and forward markets.
For more information, view our:
Related News
New rules encourage more solar to networks
More solar energy systems – big and small – will soon be able to supply more electricity to local networks, following decisions announced today by the Electric…
Have your say: next stage of distributed generation pricing reform
The Electricity Authority Te Mana Hiko is inviting feedback on proposals to update the network pricing rules for rooftop solar, batteries, solar and wind farms…
Notification to incorporate the CACTIS into the Code
The Electricity Authority Te Mana Hiko is updating the information-related common quality requirements in the Electricity Industry Participation Code to help e…