General news
New power bill graphic helps consumers see where their money goes
- Consumers
- Prices
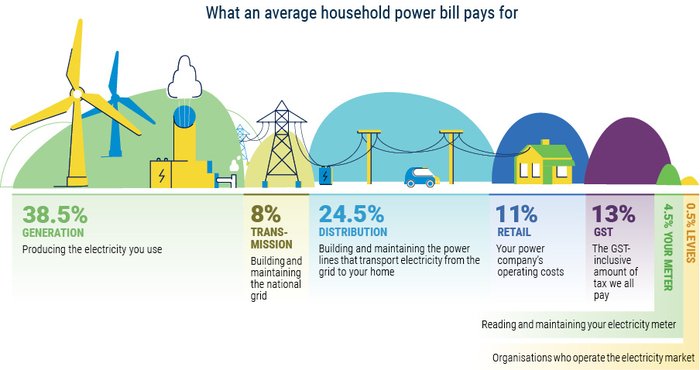
We have published a new ‘Your power bill’ graphic to help consumers better understand what they’re paying for when they receive their power bill. The new graphic shows how seven types of electricity system costs contribute to the total average monthly power bill for households based on current data.
New Zealand’s electricity system relies on a range of services coming together to power households and businesses, and we all pay for these services through our bills. Andrew Millar, General Manager Retail and Consumer, notes that New Zealand’s electricity system has changed significantly over the decade since the Authority last calculated the breakdown of costs in an average power bill.
“As our economy electrifies, our electricity system is also shifting away from reliance on a few big generators to supply electricity, to include more smaller scale renewable generation located closer to communities. While more generation will reduce our power bills over the long term, we are currently feeling the short-term impact of a system under pressure,” Millar says.
“For example, the higher proportion of generation costs in the average retail power bill reflects higher wholesale power prices due to increased demand for electricity during peak periods, relatively dry weather conditions and gas supply uncertainty.”
The Authority’s data sources and resources have also evolved, and external influences such as interest rates also influence the bill breakdown.
“To increase bill transparency through this period of rapid system change, we will now review and republish this data annually, alongside relevant market insights,” Millar says.
“This aligns with the Authority’s broader work to improve transparency in the electricity sector and empower consumers to gain control over their energy use and costs, while addressing the systemic issues contributing to high retail power prices.”
What costs are included in the average power bill?
New Zealand generates much of its electricity at big hydro power stations in the South Island. That power needs to be moved or ‘transmitted’ around our long, skinny country to where it’s needed. This is where the national grid comes in, a portion of your bill pays for that. Power then needs to be transported to your house along power lines, and these need to be built and looked after so your bill includes distribution costs.
Your power company purchases and manages all this for you, so their operating costs also contribute to your bill. The rest of what you pay for is meter reading and upkeep, GST and the government levies for operating and regulating the electricity market where electricity is bought and sold.
Over the last decade, the proportion of generation costs has increased from 32% to 38.5%
The proportion of generation costs in the average power bill has increased, reflecting higher wholesale electricity prices. Increased demand for electricity during peak periods, relatively dry weather conditions and gas supply uncertainty have contributed to price rises, compounded by delays in generation investment, including due to the COVID-19 pandemic, and uncertainty surrounding Tiwai Point’s future.
The proportion of distribution costs has decreased from 27% to 24.5% and proportion of transmissions costs has decreased from 10.5% to 8%
Distribution and transmission costs have decreased as a proportion of the bill, due to the timing of when the Commerce Commission set regulated distributors’ revenues. This is because the last Commerce Commission reset in 2020 occurred during a period of low interest rates, resulting in reduced pressure on these costs relative to the other services included in a power bill.
The grid owner and distributors’ revenues have recently been reset at a time with higher interest rates and these costs are beginning to be passed through now to consumers. We may see an increase in the proportion of distribution costs when analysing the average power bill in future years.
The proportion of retail costs has decreased
The proportion of retail costs in the average household power bill has reduced slightly – although retail costs were not separately listed in our legacy bill breakdown data. The exact cause of this small reduction is unknown but may be due to differences in the methodology we used to calculate retail costs compared to our previous estimates.
The proportion of metering costs has increased from 3.5% to 4.5%
The proportion of metering costs has increased slightly. This may be due to the significant uptake of smart metering technology over the past decade, and differences in the methodology used to calculate metering costs compared to earlier estimates.
Find out more: Your power bill
Related News
Next steps in our network pricing reform work
The Electricity Authority welcomes Transpower’s consultation for its operational review of the Transmission Pricing Methodology. Efficient network pricing is e…
New rules for power companies to improve bills, reduce bill shock and introduce product information standards
The Electricity Authority Te Mana Hiko has announced new rules to protect consumers by improving electricity bills, preventing large back bills and requiring p…
Are ASX futures prices too high?
In the New Zealand wholesale electricity market, participants can buy and sell hedges as a possible method of managing risk caused by spot price volatility.