FTR yield curve
A visualisation of financial transmission rights (FTR) prices and cleared megawatts by month.
- Transmission
- Wholesale
About the FTR yield curve
This table shows the historical record of financial transmission rights (FTR) prices for each FTR path. You can choose to view either:
- the megawatts cleared for each contract and auction, or
- the $/MWh price, which shows the FTR market's expectation of the price difference between the two nodes at either end of the path for a set number of months in the future.
A positive price indicates that the price at the start of the path (the source node) is expected to be lower than the end of the path (the sink node).
Related charts and dashboards
All chartsFTR obligation prices
This dashboard shows FTR obligation prices broken down by the price between each pair of nodes in the complete FTR route.
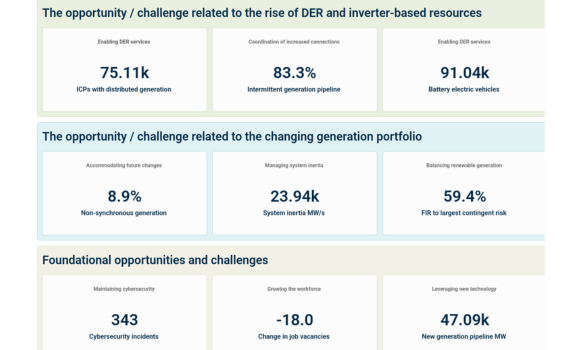
Future security and resilience indicators
Monitoring the opportunities and challenges to the future security and resilience of New Zealand's power system.
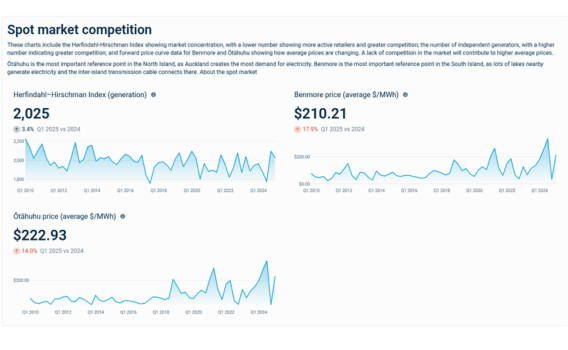
Competition
Quarterly data on the key indicators of retail electricity market competition, showing how competition is evolving in the wholesale and retail markets.
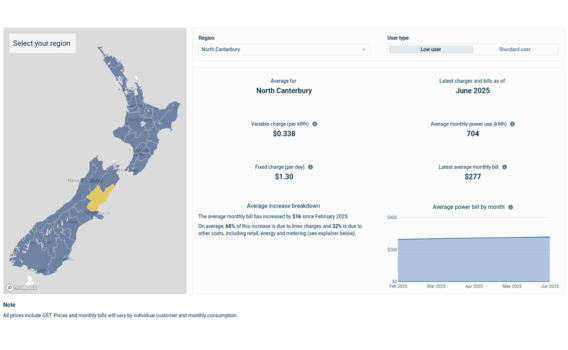
Regional power prices
What’s your region’s average power bill and how does yours compare?
Eye on electricity
View all
The impact of La Niña summers on hydro inflows
Geography, locational pricing and price separation