Eye on electricity
Changes in demand and price ‘peakiness’ since 2005
- Generation
- Prices
This article analyses long-term trends in electricity demand ‘peakiness’ in New Zealand over the last 20 years. The first half of this article analyses long-term trends in electricity demand peakiness and the second half analyses electricity spot price peakiness.
This analysis includes several charts with different axis scales which clearly display trends. Not all trends shown are as steep as they appear in the charts and it is important to take note of the scale of the Y-axes.
Part one: Demand
A key finding of this analysis is that maximum and mean peak demand has increased over the last 20 years.
This analysis of demand ‘peakiness’ refers to the ratio of peak demand (which typically occurs either in the early morning or evening) to the average demand of the same day. While ‘peak demand’ refers to the gigawatt of electricity needed to meet the maximum daily electricity demand.
Figure 1 shows how maximum demand has changed over time and Figure 2 shows the same for average demand.
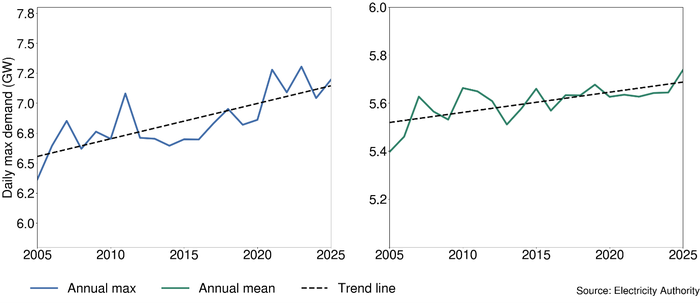
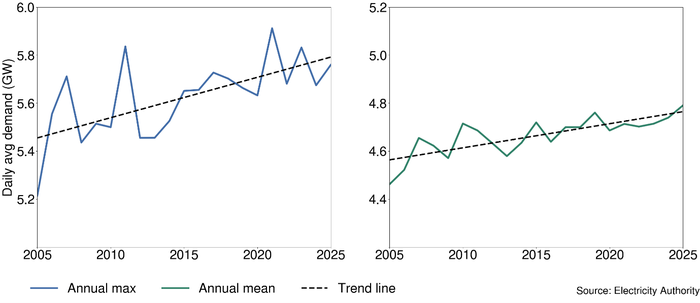
Both daily maximum and daily mean demand in New Zealand have been trending up. This demand increase is due to population increases, new technology being adopted, and electrification in the residential, transport, commercial and industrial sectors. These factors outweigh energy efficiency gains and installed 'behind-the-meter' generation (mostly rooftop solar).
Figure 1 shows that the maximum demand in a single period, or peak demand of the day, has been increasing. However, Figure 2 shows that demand has been increasing overall. So, to get an accurate idea of how demand ‘peakiness’ has changed over the last 20 years, we compare the ratio of peak demand to the average demand of the same day.
Demand is getting less ‘peaky’ in general
Figure 3 shows how the ratio of daily maximum demand to daily average demand has changed over time.
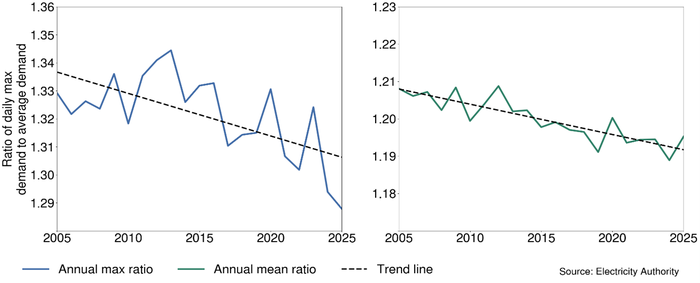
While peak demand itself has been increasing as expected, demand ‘peakiness’ ie, peak demand relative to the daily average demand, has trended down. Initiatives like demand-side flexibility and time-of-use plans can cause this to happen, but other factors, like peak transmission pricing, may have an impact.
Even though demand has risen, the electricity sector has successfully utilised strategies to distribute load so that New Zealand's peak demand is not as ‘peaky’. Typically, there is a morning demand peak and an evening demand peak that each span a few hours. This previous Eye on Electricity article contains a more in-depth explanation on how electricity demand varies throughout the day and the year.
Figure 4 shows how the peakiness of demand during the morning and evening peaks has changed over time.
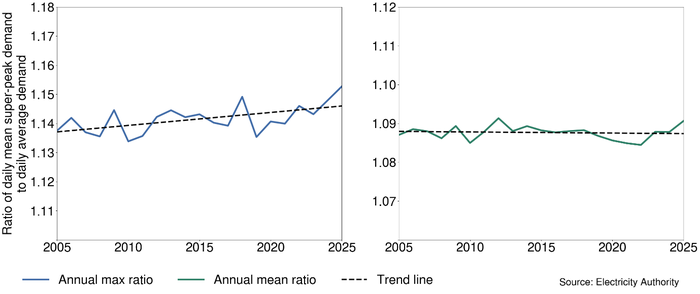
While the maximum demand of the day is lower relative to daily demand (Figure 3), the entire morning and evening peak period demand relative to daily demand is marginally higher and stayed about the same on average.
Even though there has been some success of shifting demand from when it is highest, demand can only be shifted so far. Consumers need higher levels of electricity during winter mornings and evenings. These things can only be delayed for so long, so the overall morning and evening peaks are still high.
Demand and load shifting is likely to keep increasing
This analysis highlights how New Zealand has been able to shift some load to reduce peak capacity risk. Demand is likely to keep increasing but there will likely be a continued uptick in time-of-use plans due to new rules set by the Electricity Authority Te Mana Hiko that make offering them compulsory for large retailers. Simple things like timers on dishwashers, washing machines, driers, heat pumps or central heating can contribute to shifting demand. This improves security of supply and makes electricity cheaper for consumers.
Ultimately, the most important factor in reducing peak capacity risk is making sure new generation investment keeps up with increasing demand. Currently, the generation investment outlook is looking more than sufficient to keep up with demand.
Part two: Price
Maximum prices have declined but high prices are happening more frequently each year.
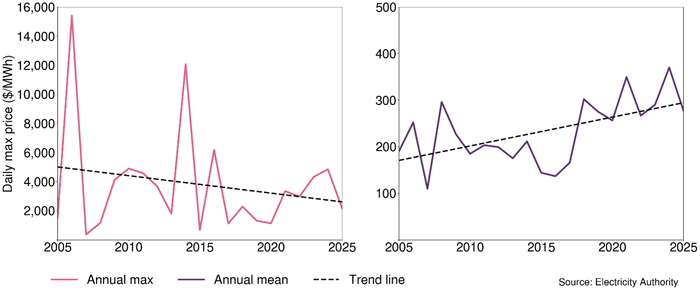
Figure 5 shows how daily maximum prices have changed since 2005.
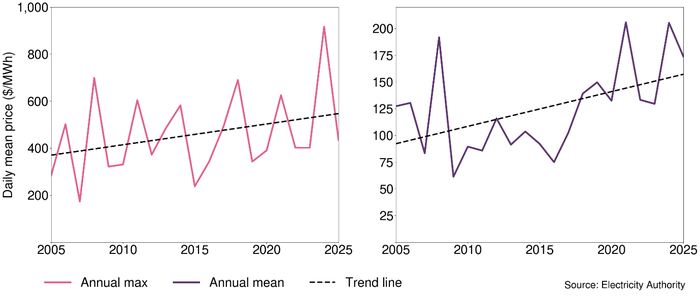
Annual maximum prices have been trending down (left plot). However, the annual average of daily maximum prices is trending up (right plot). This is because maximum prices have become lower but high prices are happening more frequently in a year, driving up the average. Figure 6 shows how the daily average prices have changed over time.
Average wholesale electricity spot prices have increased over the past 20 years even after adjustment for inflation. This is largely due to the unexpectedly rapid decline in New Zealand gas production, increases in the coal price and rising demand. Investment was also slow due to over-capacity from 2008 and investment headwinds including uncertainty over the future of the Tiwai aluminium smelter and the Lake Onslow pumped hydro scheme.
Figure 6 shows that electricity spot prices have been increasing overall but to get an accurate idea of how price ‘peakiness’ has changed, we need to compare peak prices to the average prices of the same day.
Wholesale electricity spot prices are more peaky
Figure 7 shows the trend in the ratio of the daily maximum price in a half-hour period compared to the daily average price of the same day.
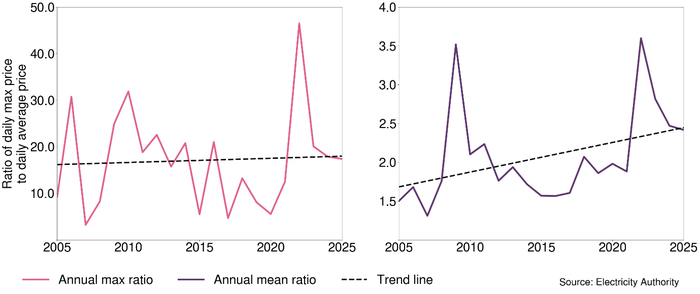
Similar to the absolute maximum prices (Figure 5), the annual maximum price peakiness ratio has not trended up significantly (left), but the annual average has (right). As with absolute maximum prices, this is because there have been more instances of very high prices relative to the average prices throughout the year.
Typically, electricity spot prices are highest during the morning and evening demand peaks.
Figure 8 shows how the peakiness of prices during the morning and evening demand peaks has changed over time.
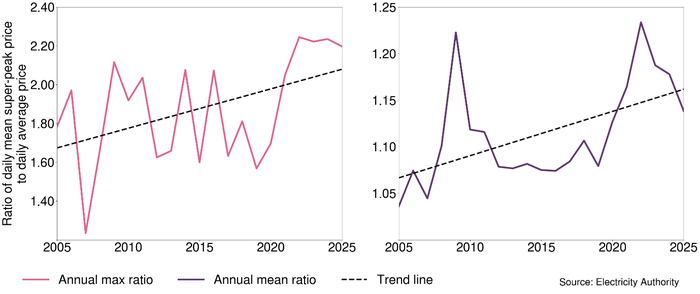
The prices during the daily demand peaks have been increasing relative to daily average prices. Overall, wholesale electricity spot prices have become higher during super-peak times relative to average prices over the last 20 years.
Wholesale electricity spot prices are likely peakier due to increased renewable generation
Price peakiness is primarily related to price volatility. When prices are more volatile, instances of very high and very low pricing increase. Having a highly renewable electricity sector goes hand-in-hand with high electricity price volatility. Increased volatility is due to renewable generation depending on short-term weather patterns. When comparing price peakiness to the annual share of renewable generation we can observe the strong relationship between them (Figure 9).
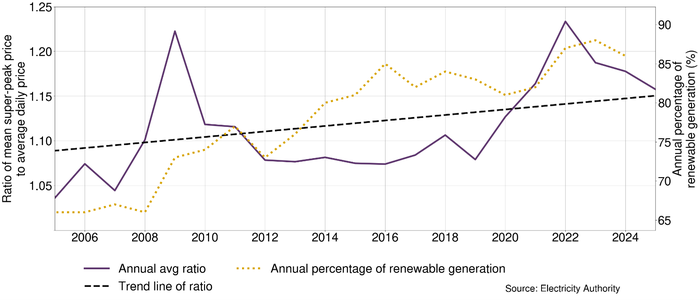
Currently, the generation investment outlook shows an influx of solar and wind generation investment. This new intermittent renewable generation may lead to increased price volatility and price peakiness. However, with increased capacity, the average price should begin to decrease as our reliance on high cost thermal generation decreases.
Related News
New rules encourage more solar to networks
More solar energy systems – big and small – will soon be able to supply more electricity to local networks, following decisions announced today by the Electric…
Have your say: next stage of distributed generation pricing reform
The Electricity Authority Te Mana Hiko is inviting feedback on proposals to update the network pricing rules for rooftop solar, batteries, solar and wind farms…
Latest retail gross margin data published
The Electricity Authority Te Mana Hiko has published the latest retail gross margin data for the 2024/25 financial year. The RGM is retailer revenue remainin…