Eye on electricity
Hydro lakes, dry summer risk and spot electricity prices
- Consumers
- Generation
- Prices
In New Zealand most electricity is generated by hydro dams, with the majority of these located in the South Island. Many dams have storage reservoirs which hold water for future use.
Storage in each hydro lake depends on the difference between inflows - either rain and snowmelt - and outflows – the water used in generating electricity. If a hydro dam consumes more water from the reservoir than is refilled by inflows, hydro storage decreases.
While New Zealand’s hydro lakes are large enough to see from space, their hydro reservoir capacity is surprisingly small - since there are limits on minimum lake levels. When all hydro reservoirs are full, the stored energy amounts to approximately five weeks of electricity generation over winter1. This makes managing hydro storage critical to the electricity sector.
New Zealand had its wettest winter on record in 20222, resulting in above average hydro storage. In spring, however, inflows at many lakes were below average. These low inflows, coupled with high hydroelectricity generation, caused hydro storage to fall across all the major lakes.
The outlook for summer 22/23 is for La Niña conditions, similar to the previous two summers. During La Niña, New Zealand tends to experience warm and wet conditions in the North and dry conditions in the South3.
Anticipating another La Niña summer, many generators began to conserve water in early September. This was achieved by placing more hydroelectricity in higher cost offer tranches in the wholesale electricity market. This manifested in higher average spot prices in September and October.
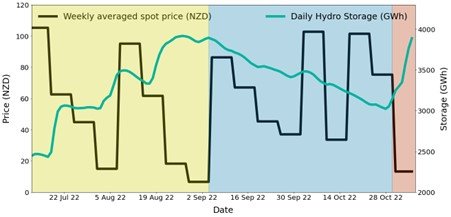
Figure 1 shows national hydro storage levels and the national average weekly spot electricity price between 12 July and 6 November 2022. The yellow area shows how, when storage was increasing, there were more instances of weekly average spot prices below $50/MWh. However, when storage began decreasing, weekly average spot prices were higher, as per the blue area.
During the first week of November, there was heavy rain and large hydro inflows for lakes in the South Island. Weekly average spot prices decreased to $16.7/MWh, see red area in Figure 1.
Near-term forward electricity prices are also sensitive to storage levels, as rain events provide confidence for higher storage for the near future. The first week in November was no exception, with near-term forward prices4 falling by around $15/MWh.
Find out more on the Electricity Authority’s EMI website – see electricity spot prices, forward prices and hydro storage plots.
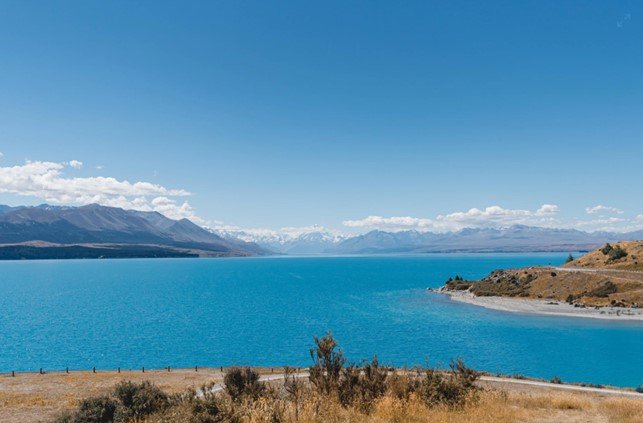
Image: Lake Tekapō
2. https://niwa.co.nz/climate/summaries/seasonal/winter-2022
4. Our explainer on forward prices can be found here: Eye on Electricity: The forward electricity market explained
Related News
Watch our Quarterly Update, 22 July 2026
We had a great turnout at our latest online quarterly update on Wednesday 22 July. Thanks to all those who tuned in.
Electricity Authority review finds growing awareness of services that help consumers
The Electricity Authority Te Mana Hiko has published a post-implementation review of measures introduced in 2021 to increase awareness of Utilities Disputes, a…
Breaking the link between gas supply and power prices and what it means for New Zealand’s energy future
For years, New Zealand enjoyed relatively stable wholesale electricity prices. While there were occasional spikes during dry years, the overall cost of generat…