Eye on electricity
Eye on electricity: Five-minute price volatility and intermittent generation
- Generation
- Prices
Most new electricity generation capacity built in New Zealand in recent years has been solar or wind. Our monitoring of generation investment shows this trend is likely to continue.
Solar and wind generation are intermittent. Unlike hydro or thermal generation, they aren’t continuously available (because the Sun can be covered by clouds, and wind is not constant).
Unexpected drops in wind generation often cause spot electricity prices to spike, so it’s possible that having a higher proportion of demand met by intermittent generation could lead to spot prices becoming more volatile.
If this were the case, moving to five-minute price settlements (from the current 30-minute settlements, which are the time-weighted average of five-minute prices) could help reduce volatility. Five‑minute settlement may improve investment incentives for grid‑scale batteries, which can respond quickly when intermittent generation is suddenly unavailable. However, if intermittent generation does not materially increase five‑minute price volatility, this change is unlikely to deliver these benefits.
This article examines the relationship between intermittent generation and five-minute price volatility.
Price volatility and intermittent generation capacity
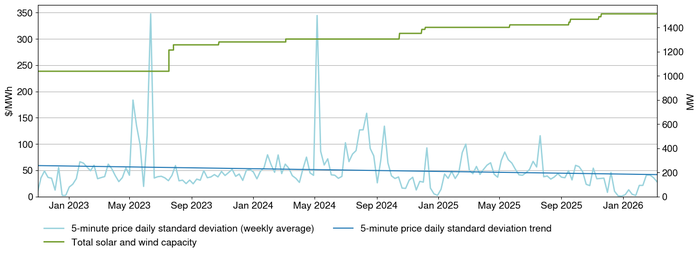
To measure the volatility of five-minute prices, the Electricity Authority calculated the standard deviation of prices for each day since real-time pricing began in November 2022. The standard deviation measures the variation of the prices each day from the average daily price, so a higher standard deviation indicates a wider range of prices (ie, prices are more volatile).
Figure 1 shows how price volatility has changed over time compared to solar and wind capacity. The price volatility trend shows a slight decrease over time ($5/MWh each year), with two large spikes in 2023 and 2024 due to cold weather driving high demand during periods of low wind generation. In contrast, solar and wind capacity has increased, with an additional 476MW installed since November 2022. This indicates that five-minute prices have not become more volatile as more intermittent generation has been built.
While five-minute prices have not become more volatile over time, 30-minute prices have, as explained in this Eye on electricity article. This difference may be partly due to the different timescales over which the trends have been examined. That article looked at 30-minute prices from 2015 to 2022, but as real-time pricing did not begin until November 2022, it isn’t possible to assess five-minute price volatility over the same timeframe.
The correlation between intermittent generation and price volatility
We used Pearson correlations to assess the relationship between price volatility and other factors, including intermittent generation capacity and output. The Pearson correlation measures the linear relationship between two sets of data and ranges from -1 (a perfect negative relationship, where one variable decreases at the same rate as the other increases) to 1 (a perfect positive relationship, where, as one variable increases, so does the other at the same rate). A Pearson correlation of zero indicates that there is no relationship between the two variables.
Given the complex nature of the electricity market and the number of different factors that influence the spot price, no single variable has a very strong relationship with price volatility. It’s also important to account for the relationships between different variables. For example, thermal generation is positively correlated with price volatility, which could be interpreted to mean that increased thermal output causes prices to become more volatile.
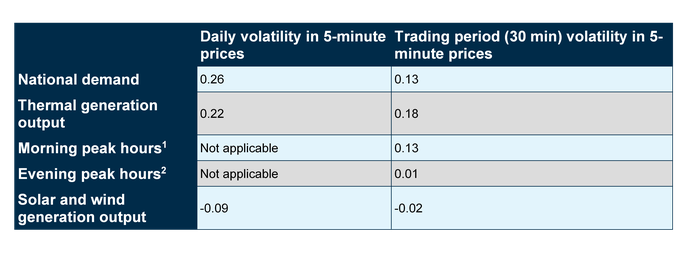
However, thermal output is much more strongly correlated (Pearson correlation = 0.5) with demand. We can see from Figure 2 below that demand has the strongest relationship to volatility, so it is more likely that high demand leads to both volatility and more thermal being switched on, rather than thermal generation itself being the main cause of volatility.
Morning peak hours were also positively correlated with volatility. This is to be expected as ‘peak hours’ occur when demand is highest, however, there is only a very weak correlation between volatility and the evening peak. This may be because there is often less generation offered in each price band during the morning peak, which can cause prices to spike if demand is higher than expected. The steeper and more significant rise in demand in mornings compared to evenings could also contribute to price volatility around this time.
Combined solar and wind generation has a very weak negative correlation, which suggests it is not currently associated with five-minute price volatility.
These results are consistent across individual years, although the correlation between daily volatility and thermal generation was noticeably weaker in 2023 (Pearson correlation = 0.02). This may be due to low gas spot prices at the time, which made thermal generation less expensive to run.
The impact of forecasting inaccuracies
Generation is only forecast for 30-minute trading periods, rather than five-minute intervals, which makes it more difficult to assess the impact of forecasting inaccuracies on the five-minute price. However, we often see spikes in the spot price when wind generation is lower than forecast (there isn’t currently enough solar generation to have the same effect).
The May 2024 price volatility spike visible in Figure 1 was partly due to wind being more than 100MW below forecast during a period of very high demand. On average, since November 2022, wind was 40MW lower than forecast during trading periods with high prices (those more than two standard deviations above the daily mean), compared to 1MW above forecast during trading periods without high prices. The Authority has recently implemented hybrid forecasting arrangements to improve forecasting accuracy and minimise price spikes.
Currently, there isn’t strong evidence to suggest that solar and wind generation are causing five-minute prices to become more volatile. However, spot prices are likely to change as thermal generation is retired and replaced by renewables.
With more national demand being met by intermittent generation each year, we’ll be closely monitoring potential price impacts. Future analysis could use data on generation investment and demand modelling to assess how price volatility is likely to change over time.
1. Binary variable with trading periods between 6:00am-9:30am equal to 1.
2. Binary variable with trading periods between 5:00pm-8:30pm equal to 1.
Related News
Marginal generators and prices in the electricity market
In the New Zealand wholesale electricity market, the price paid to dispatched generators is the nodal ‘spot price’, which is priced to reflect the ‘marginal’ g…
Energy margin data to be published monthly
The Electricity Authority Te Mana Hiko is introducing a new requirement for electricity generators to provide information.
New interactive Solar Installations Map tool
The Electricity Authority Te Mana Hiko has released an online interactive map to help people get a better view of solar power in their neighbourhoods.